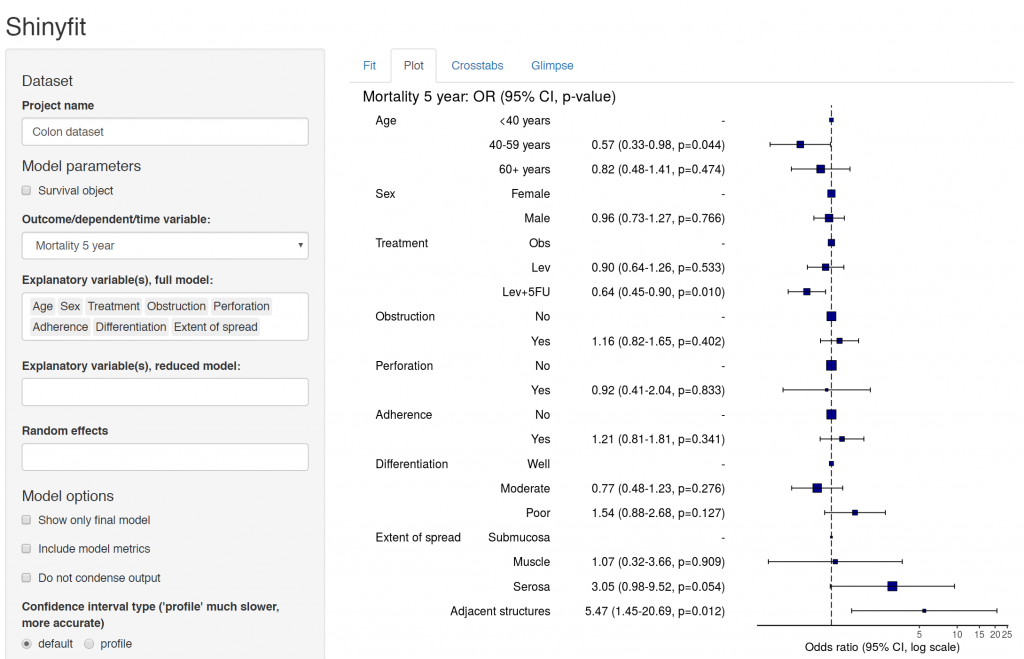
- Aim: allow access to model fitting without requirement for statistical software or coding experience.
- Audience: Those sharing datasets in context of collaborative research or teaching.
- Hosting requirements: Basic R coding skills including
tidyverseto prepare dataset (5-10 minutes). - Deployment: Any shiny platform, shinyapps.io, ShinyServer, RStudio Connect etc.
shinyfit uses our finalfit package.
Features
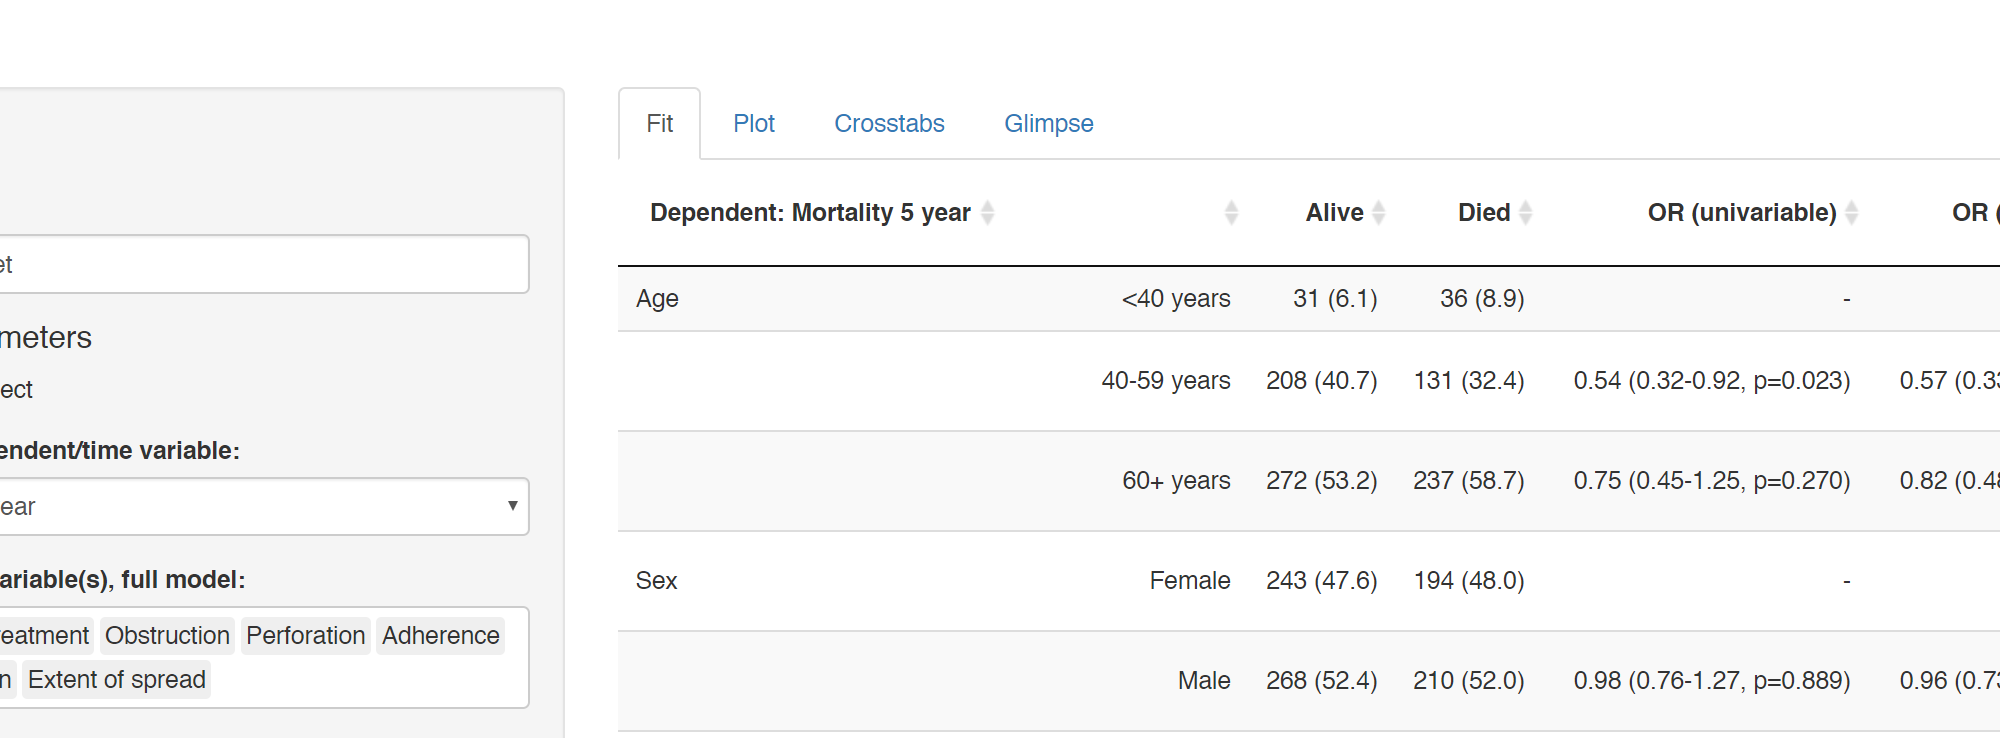
- Univariable, multivariable and mixed effects linear, logistic, and Cox Proportional Hazards regression via a web browser.
- Intuitive model building with option to include a reduced model and common metrics.
- Coefficient, odds ratio, hazard ratio plots.
- Cross tabulation across multiple variables with statistical comparisons.
- Subset data by any included factor.
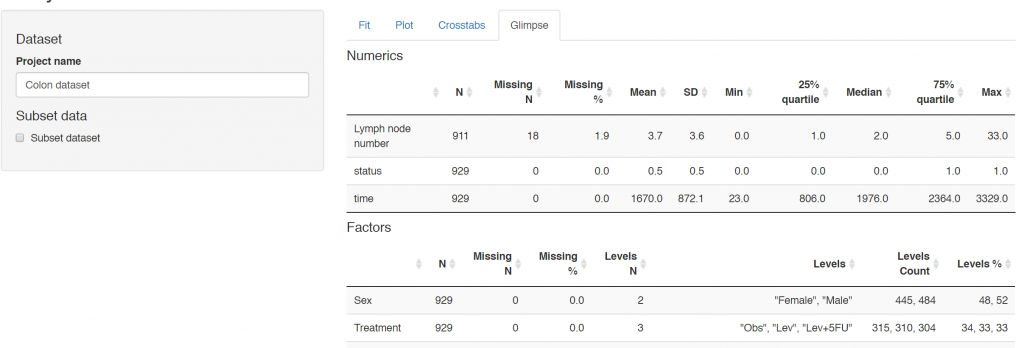
- Dataset inspection functions.
- Export tables to Word for publication or as a CSV for further analysis/plotting.
- Easy to deploy with your own data.
Examples
argoshare.is.ed.ac.uk/shinyfit_colonargoshare.is.ed.ac.uk/shinyfit_melanoma
Code
github.com/ewenharrison/shinyfitScreenshots


ff_glimpseUse your data
To use your own data, clone or download app from github.- Edit
0_prep.Rto create a shinyfit_data object. - Test the app, usually within RStudio.
- Deploy to your shiny hosting platform of choice.
- Ensure you have permission to share the data
0_prep.R is straightforward and takes about 5 mins. The main purpose is to create human-readable menu items and allows sorting of variables into any categories, such as outcome and explanatory.
Errors in shinyfit are usually related to the underlying dataset, e.g.
- Variables not appropriately specified as numerics or factors.
- A particular factor level is empty, thus regression function (
lm,glm,coxphetc.) gives error. - A variable with >2 factor levels is used as an outcome/dependent. This is not supported.
- Use
Glimpsetabs to check data when any error occurs.


